
Runs And Figures#
The data documentation should not be a list of accepted source values.
Each important family needs at least one figure that proves what was loaded,
what shape it has, and how it can be trusted before a solver or calibration
workflow consumes it.
This page is the bridge between text pages and generated assets. It explains which runs are deliberately lightweight, which figures are reused across family pages, and where complete gallery cases still need to be added.
Regenerate The Assets#
The communication figures in /_static/user_guide/data are generated by one
script:
python docs/source/user_guide/data/render_data_communication_assets.py
The script only uses versioned local examples and committed sample files. It does not call online providers, so it is suitable for documentation refreshes, offline checks, and CI-style validation.
Provider refresh scripts are separate from this renderer. For the small hydrography comparison case:
python docs/source/user_guide/data/refresh_hydrography_provider_replays.py --case couesnon --providers bdtopage osm euhydro
Run that command only when the provider artifacts should intentionally be updated; the generated GPKG files and manifest then become replay inputs for the stable documentation renderer.
Current Run Set#
Run or asset |
Data families |
Figure |
Purpose |
|---|---|---|---|
Static source inventory |
All families |
|
Show coverage by provider group. |
Contract ladder |
All families |
|
Explain the path from declaration to model use. |
Local spatial stack |
|
|
Check raster/vector alignment and CRS. |
Geology transfer case |
|
|
Show zones, legend keys, and hydraulic-property transfer. |
Local forcing files |
|
|
Check period coverage and aggregate behaviour. |
Local SIM2 grids |
|
|
Show gridded forcing support and seasonal summaries. |
Local observation chronicles |
|
|
Compare station time-series contracts. |
Local oceanic chronicle |
|
|
Check a coastal boundary-stage series. |
Local intermittency states |
|
|
Check categorical station states. |
Provider replay ladder |
All API-backed families |
|
Separate stable replay from live refresh. |
Hub’Eau replay |
Observation families |
|
Compare station metadata and chronicles by observation family. |
SHOM replay |
|
|
Show coastal station selection and sea-level chronicle. |
Hydrography replay |
|
|
Show custom, BD Topage, OSM, and EU-Hydro replay artifacts. |
Hydrography provider comparison |
|
|
Compare provider density and geometry on one locked bbox. |
Spatial Support Example#
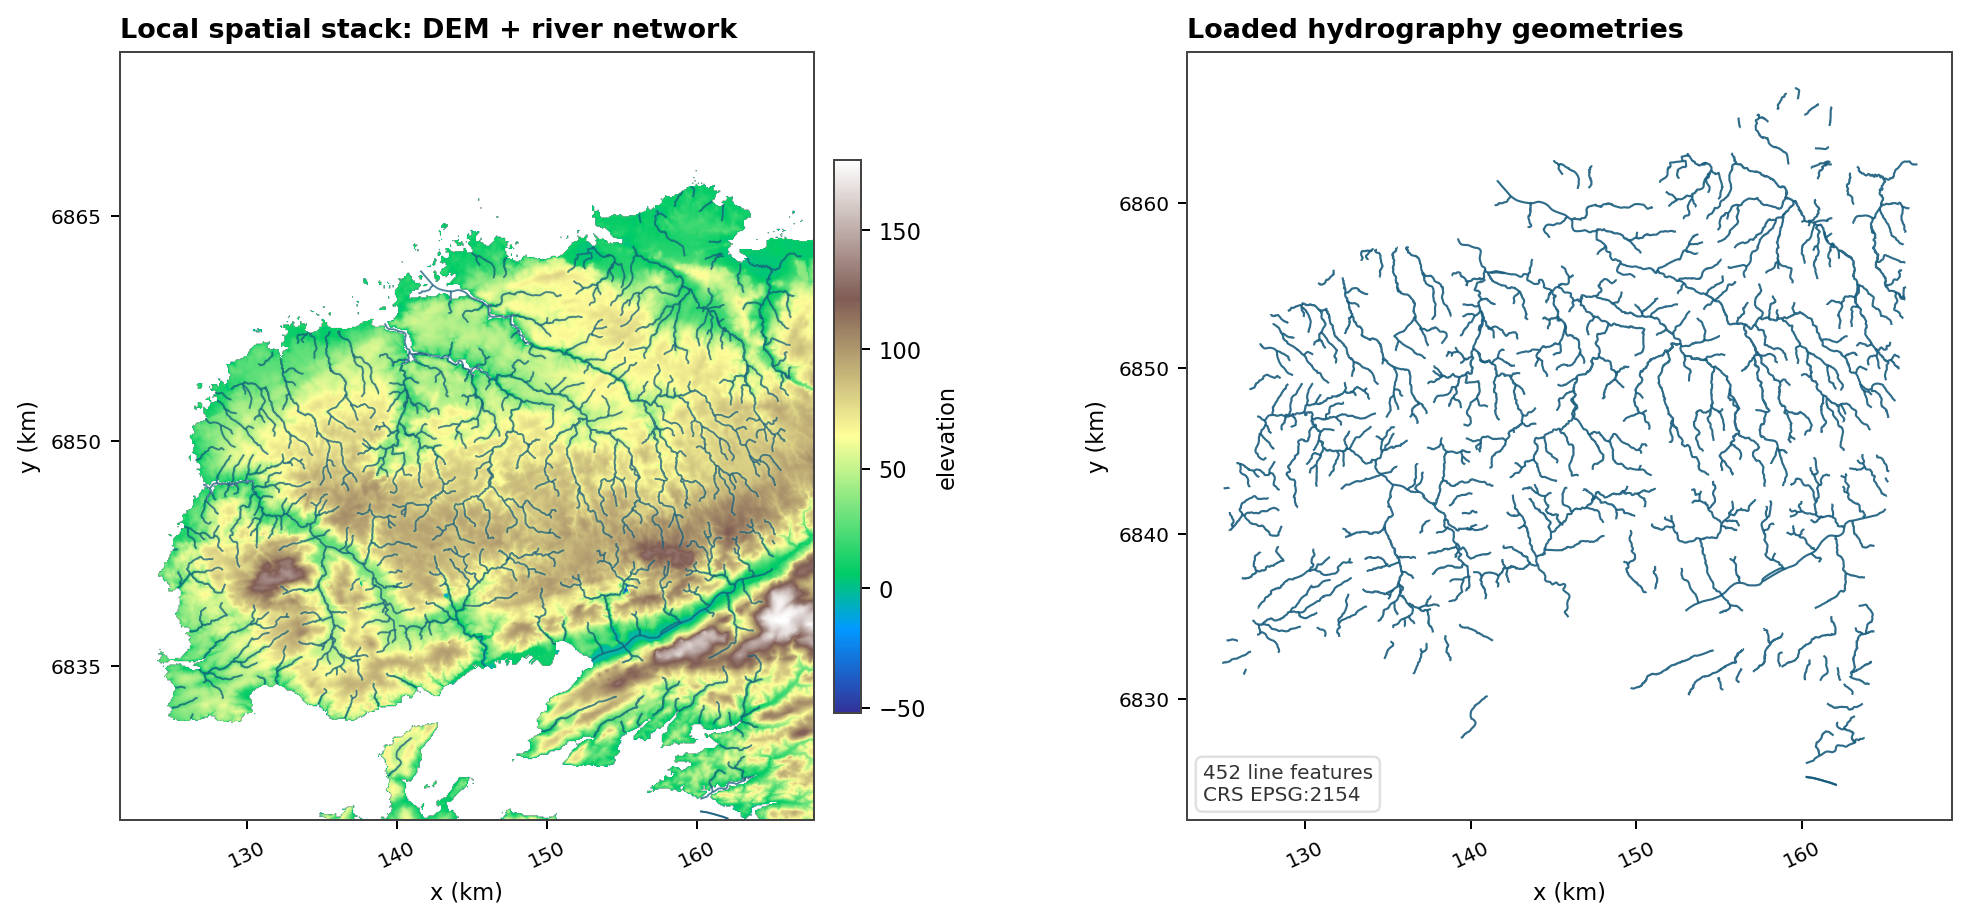
Fig. 117 This is the cheapest useful spatial check: a raster support and a vector network must agree in CRS and location before they become basin context, mesh constraints, or drainage targets.#
Forcing Examples#
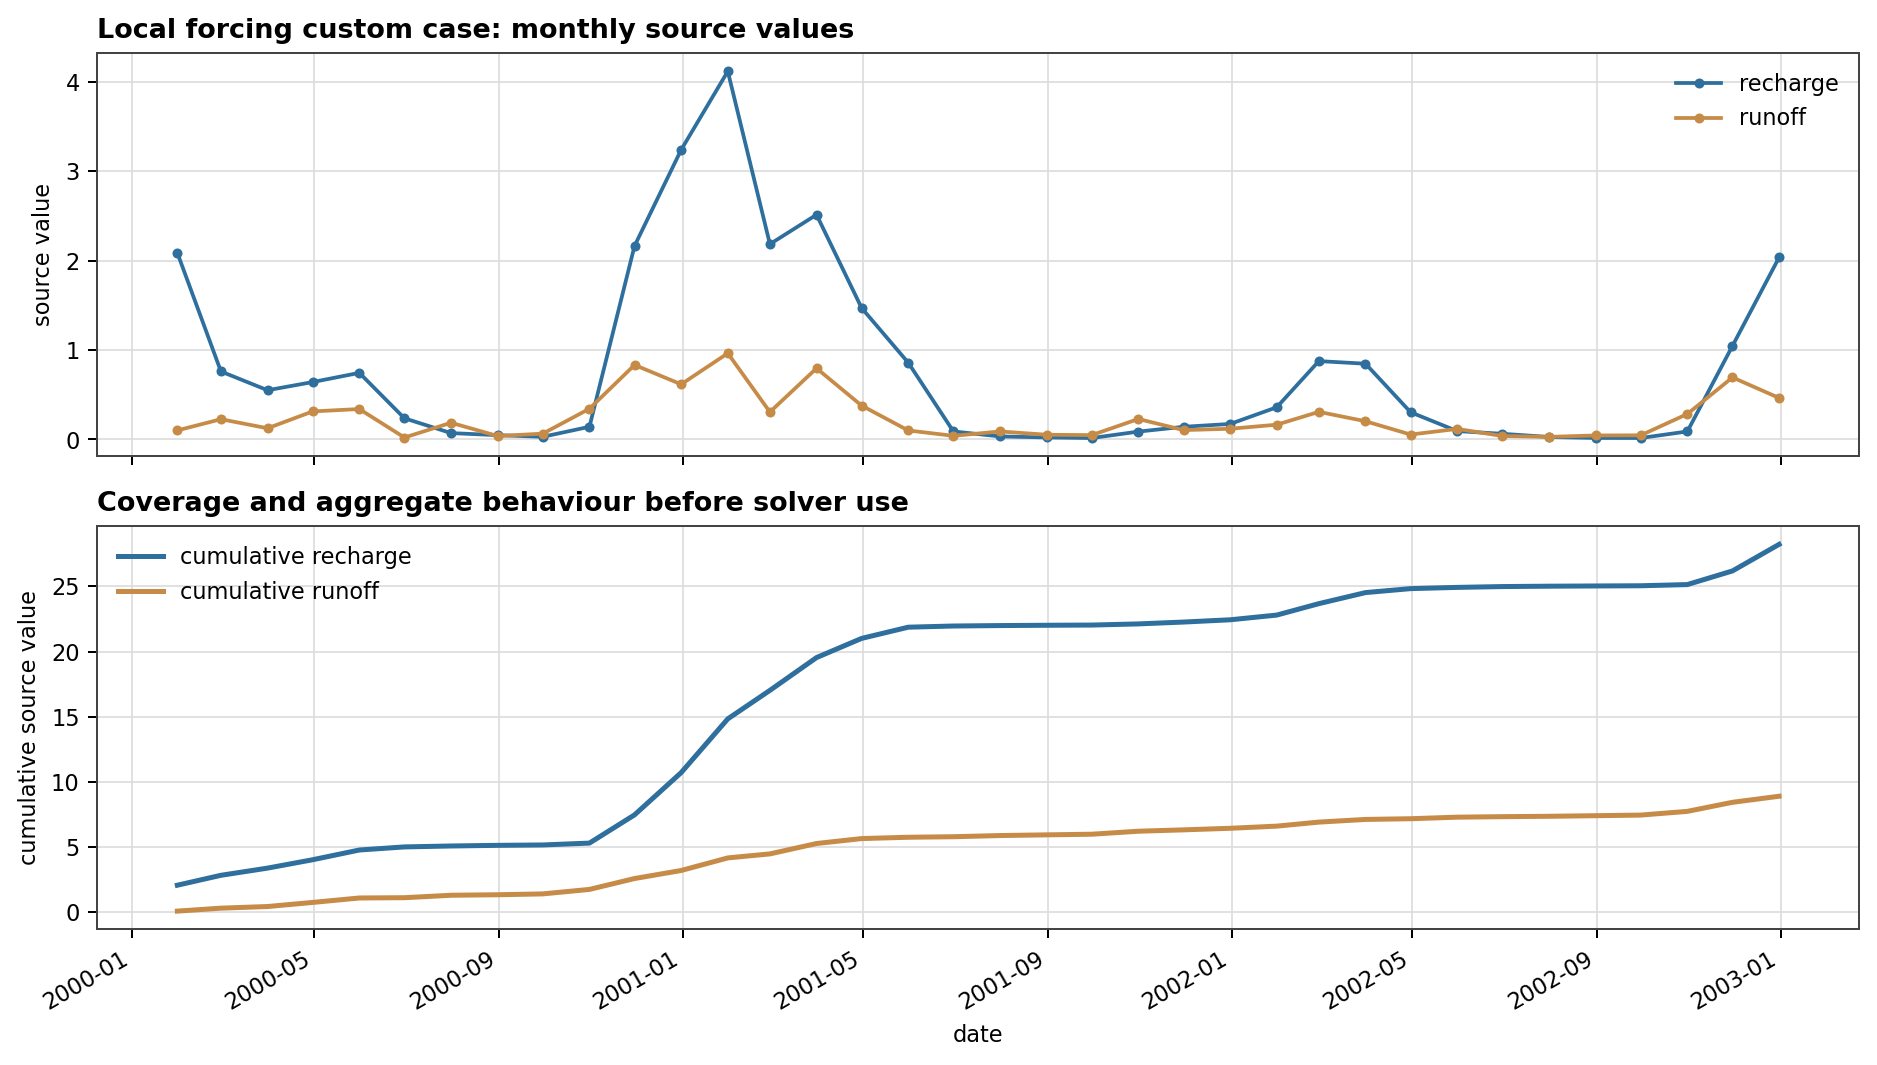
Fig. 118 Local forcing files should first be checked as time series: date coverage, magnitude, and aggregate behaviour are visible before stress-period aggregation or solver assembly.#
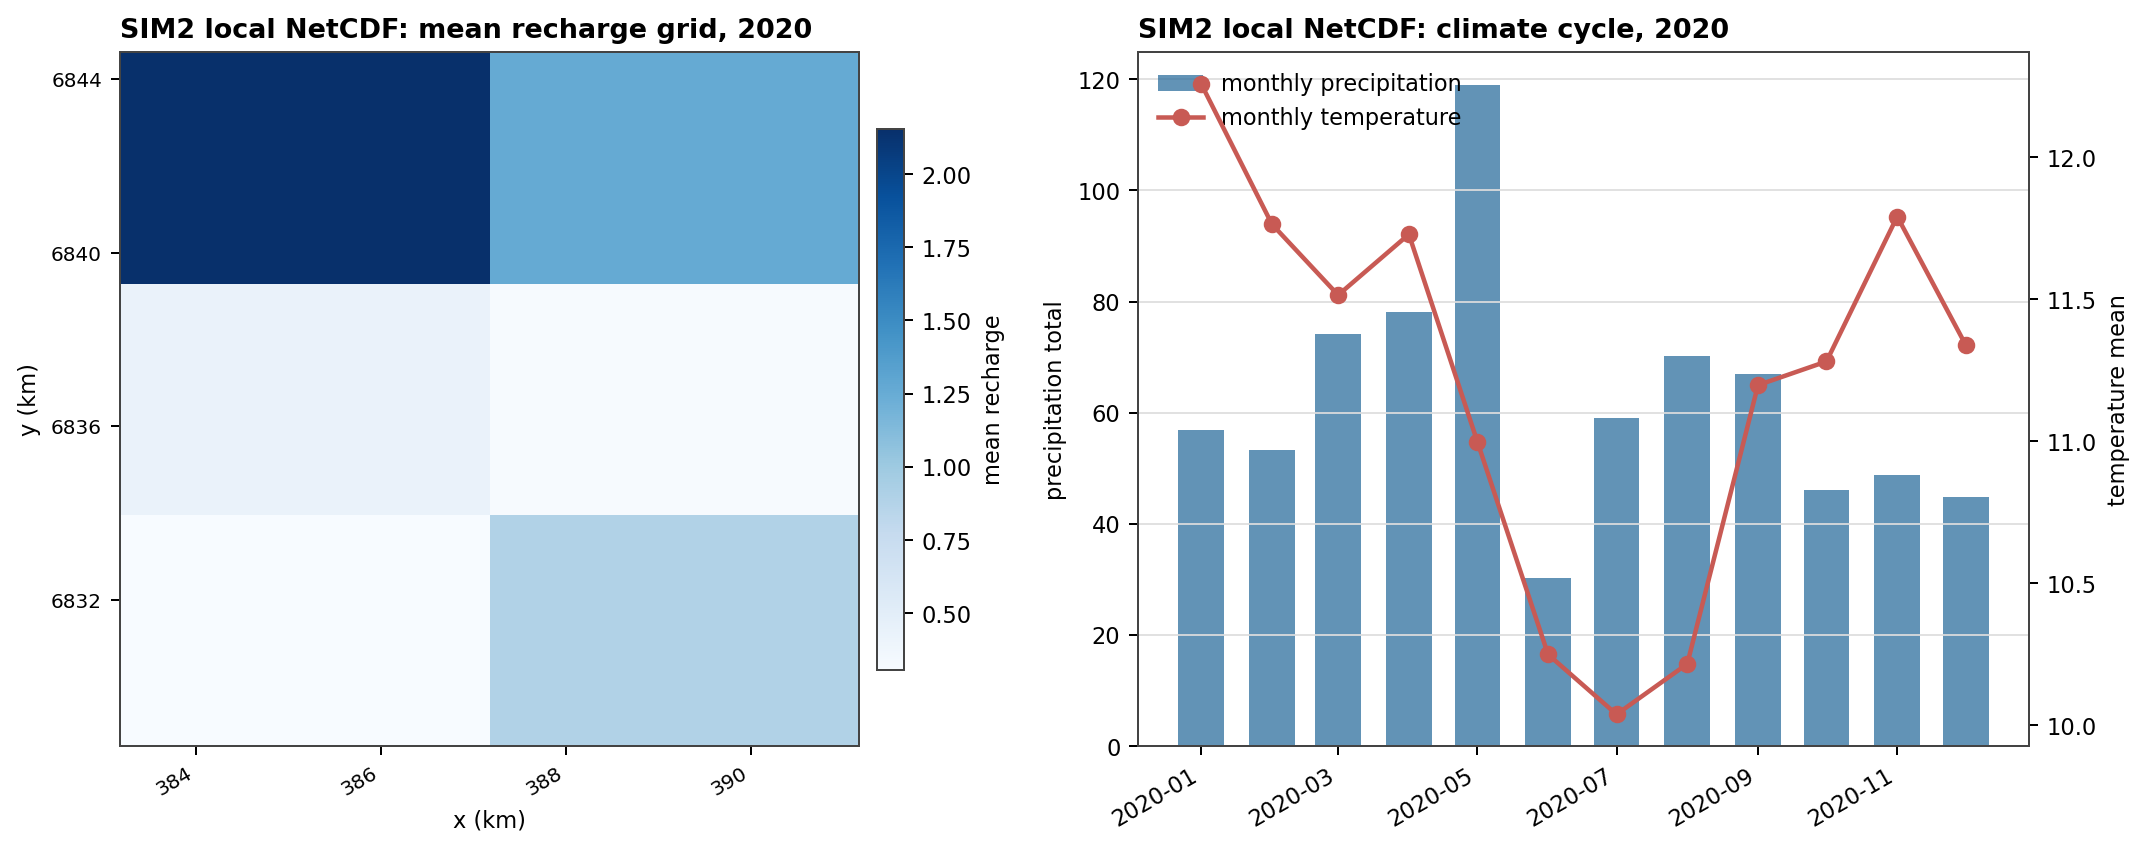
Fig. 119 SIM2-style data need both spatial and temporal checks. A gridded map shows support and alignment; a monthly summary shows whether the selected period behaves as expected.#
Observation Examples#
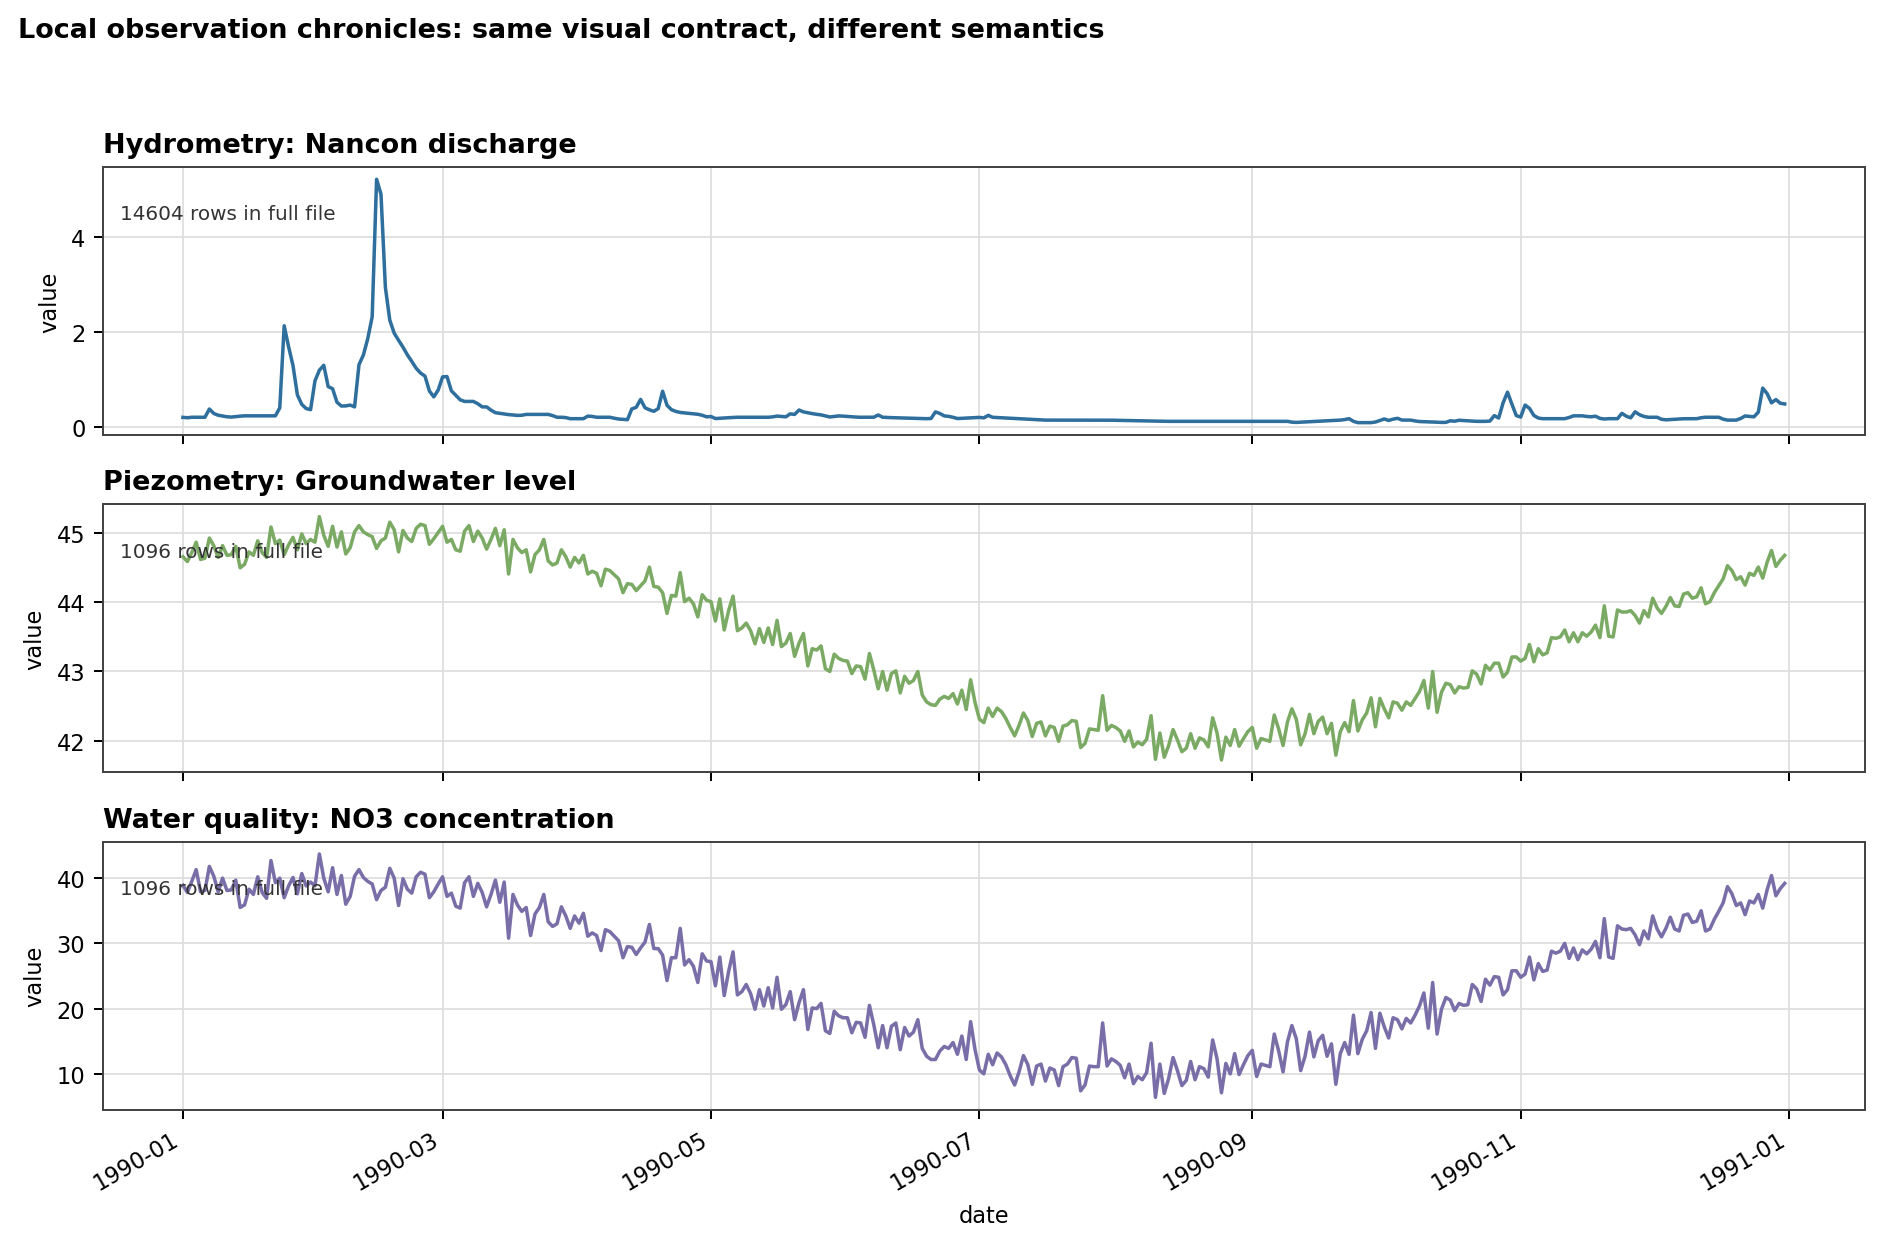
Fig. 120 The same file convention produces different semantics. Discharge, groundwater level, and chemistry all need station identity, units, period coverage, and gaps checked before they become objectives or diagnostics.#
Provider Replay Examples#
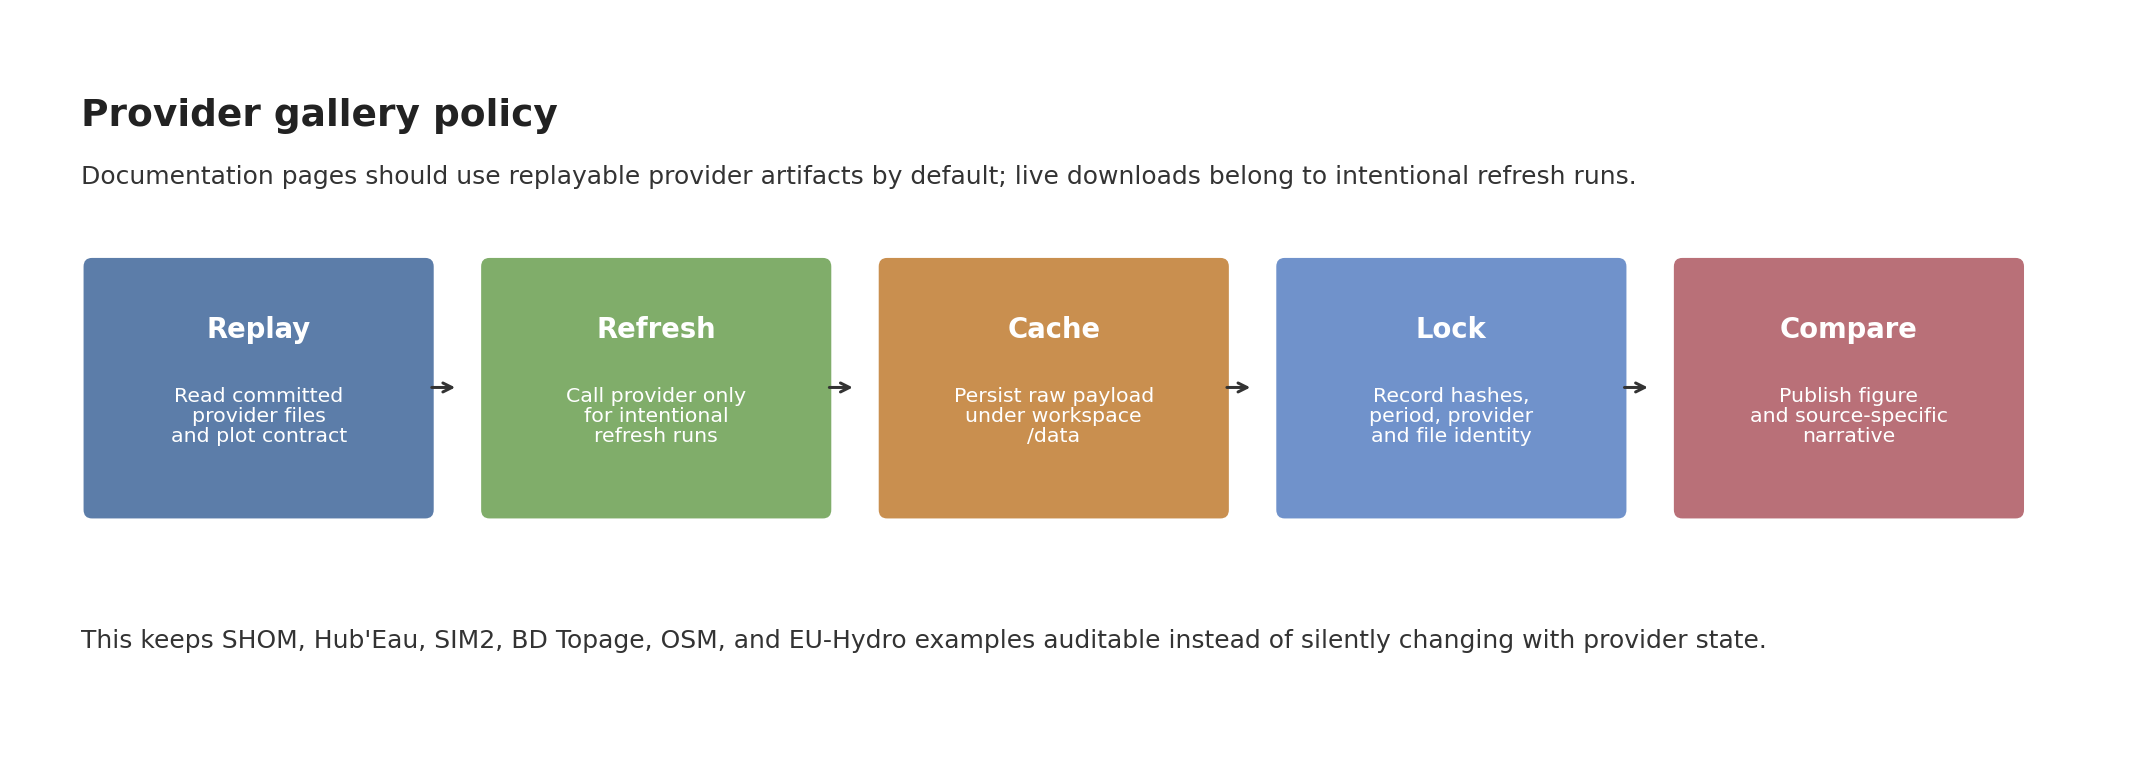
Fig. 121 Provider examples should be replayable by default. Live downloads are appropriate for intentional refreshes, but the published page should point to cached and locked artifacts.#
For provider-specific figures and next cases, open Provider Replay Cases.
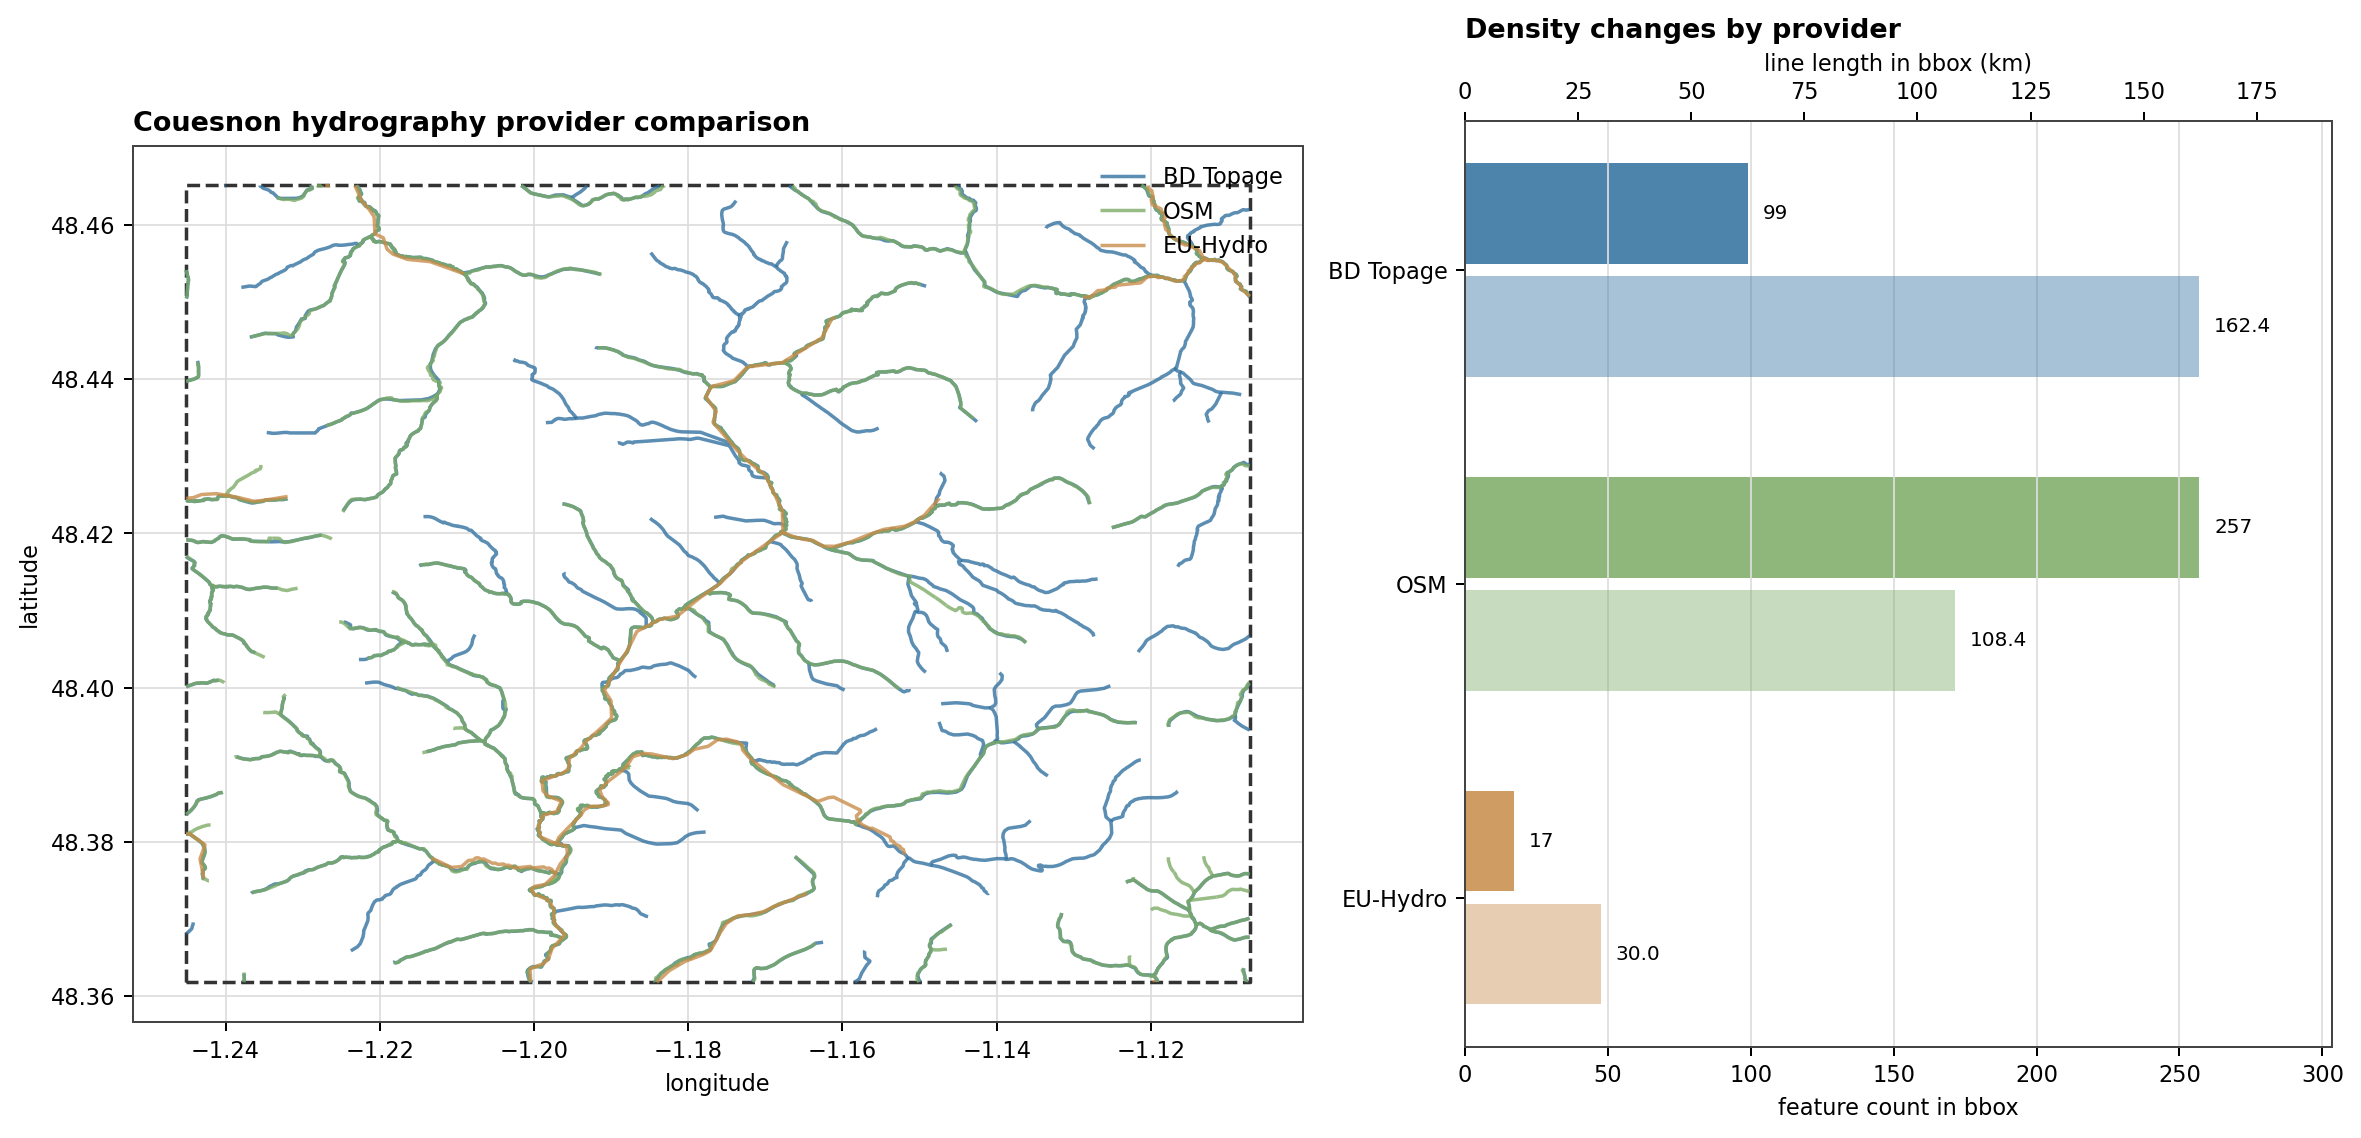
Fig. 122 The hydrography comparison is a provider-specific replay: BD Topage, OSM, and EU-Hydro are read from committed GPKG files, clipped to the same bbox, and compared through both map geometry and simple density metrics.#
Remaining Gaps#
The current local assets deliberately avoid network calls. The next complete gallery cases should target provider-specific questions:
a coastal basin for
shomandoceanicboundary stages;a second non-Nancon hydrography comparison that tests another OSM/EU-Hydro context;
a SIM2-focused data overview that shows each forcing variable separately;
a Hub’Eau observation case that displays downloaded station discovery and cached replay side by side.